Basics of Data Modeling
Basics of Data Modeling
1. Basics of Data Modeling
Data modeling is the process of creating a conceptual representation of data objects, relationships between them, and rules governing them to better understand and organize data. It is an essential step in database design and development, as it helps in creating a blueprint of a database system that can be used to build the actual system.
Depends of the extent of specification, there are three level of data modeling:
- Conceptual Data Model: describes the high-level view of data that is independent of any specific technology. It is a simple representation of entities, their attributes, and the relationships between them. It is mainly used in the early stages of development to help stakeholders understand the scope of the system.
- Logical Data Model: more detailed than a conceptual model and includes data structures, data types, and other technical details. It is used to create a blueprint of the actual database system that can be used by developers to build and maintain the database.
- Physical Data Model: most detailed and includes information about the physical storage of data on disk, tables, columns, and other technical details. It is used by database administrators to manage the database system.
2. Grain and Three Normal Forms of Databases
2.1 Grain of Data
Grain
The grain of data refers to the level of detail or granularity at which data is stored in a table. It determines the level of aggregation or disaggregation of data. For example, if you have sales data for a company, the grain of the data could be at the product level, meaning that each row in the table represents a sale of a specific product. Alternatively, it could be at the store level, meaning that each row represents the total sales for a particular store. The choice of grain is important because it affects the level of detail and accuracy of the information that can be obtained from the data. Choosing the appropriate grain is essential to ensure that the data is useful for analysis and decision-making.
Primary Key
A primary key is a unique identifier for each row in a table. It is used to ensure that each row is unique and can be identified using the primary key. The choice of primary key is important because it affects the level of detail or granularity at which data is stored in a table.
The Grain is a concept associated with entity, while the primary key is a specific concept in database construction. Grain and primary key are related to each other in that they both determine the level of detail or granularity at which data is stored in a table.
For example, if the grain of the data is at the product * date level, the primary key might be a combination of the product ID and the date of sale. If the grain is at the user * store level, the primary key might be a combination of the product ID and store ID.
This ensures that each row in the table is unique and can be identified using the primary key. In other word, the primary key assure the grain of the data.
2.2 Three Normal Forms of Databases
The three normal forms (1NF, 2NF, and 3NF) are standards for ensuring that a database is well-organized and free of anomalies. These rules are used to eliminate data redundancies and inconsistencies to create a more efficient and reliable database system.
- The first normal form (1NF): each table have a primary key and that each column in the table is atomic, meaning that it contains only one value. T
- The second normal form (2NF): each non-key column in the table is functionally dependent on the primary key.
- The third normal form (3NF): each non-key column in the table is not transitively dependent on the primary key.
The benefit of the three normal forms (1NF, 2NF, and 3NF) of databases is that they help to ensure that a database is well-organized and free of anomalies. By eliminating data redundancies and inconsistencies, the database becomes more efficient and reliable. This makes it easier to maintain and update the database, and also helps to ensure that the data is accurate and consistent.
3. ER Modeling
Entity-Relationship modeling(ER modeling) is a data modeling technique used to create a graphical representation of entities and the relationships between them. The technique is based on the use of three main components: entities, attributes, and relationships. Entities represent the real-world objects or concepts that are being modeled, attributes represent the properties or characteristics of the entities, and relationships represent the associations between the entities.
ER modeling clearly describes the relationship among real entities in business, thus is usually applied on an enterprise-wise data modeling. Theoretically, a ER model strictly satisfies 3NF and have no data redundancy. Also, a ER model is a top-down method for data modeling. For these reasons, ER modeling is usually applied for construction of OTLP database.
On the other have, ER modeling requires the developer the have a whole picture in mind about business. Developing a ER model database can be very time-consuming and costly. Therefore, ER modeling is not suitable for an analytical database such as data warehouse or data-mart.
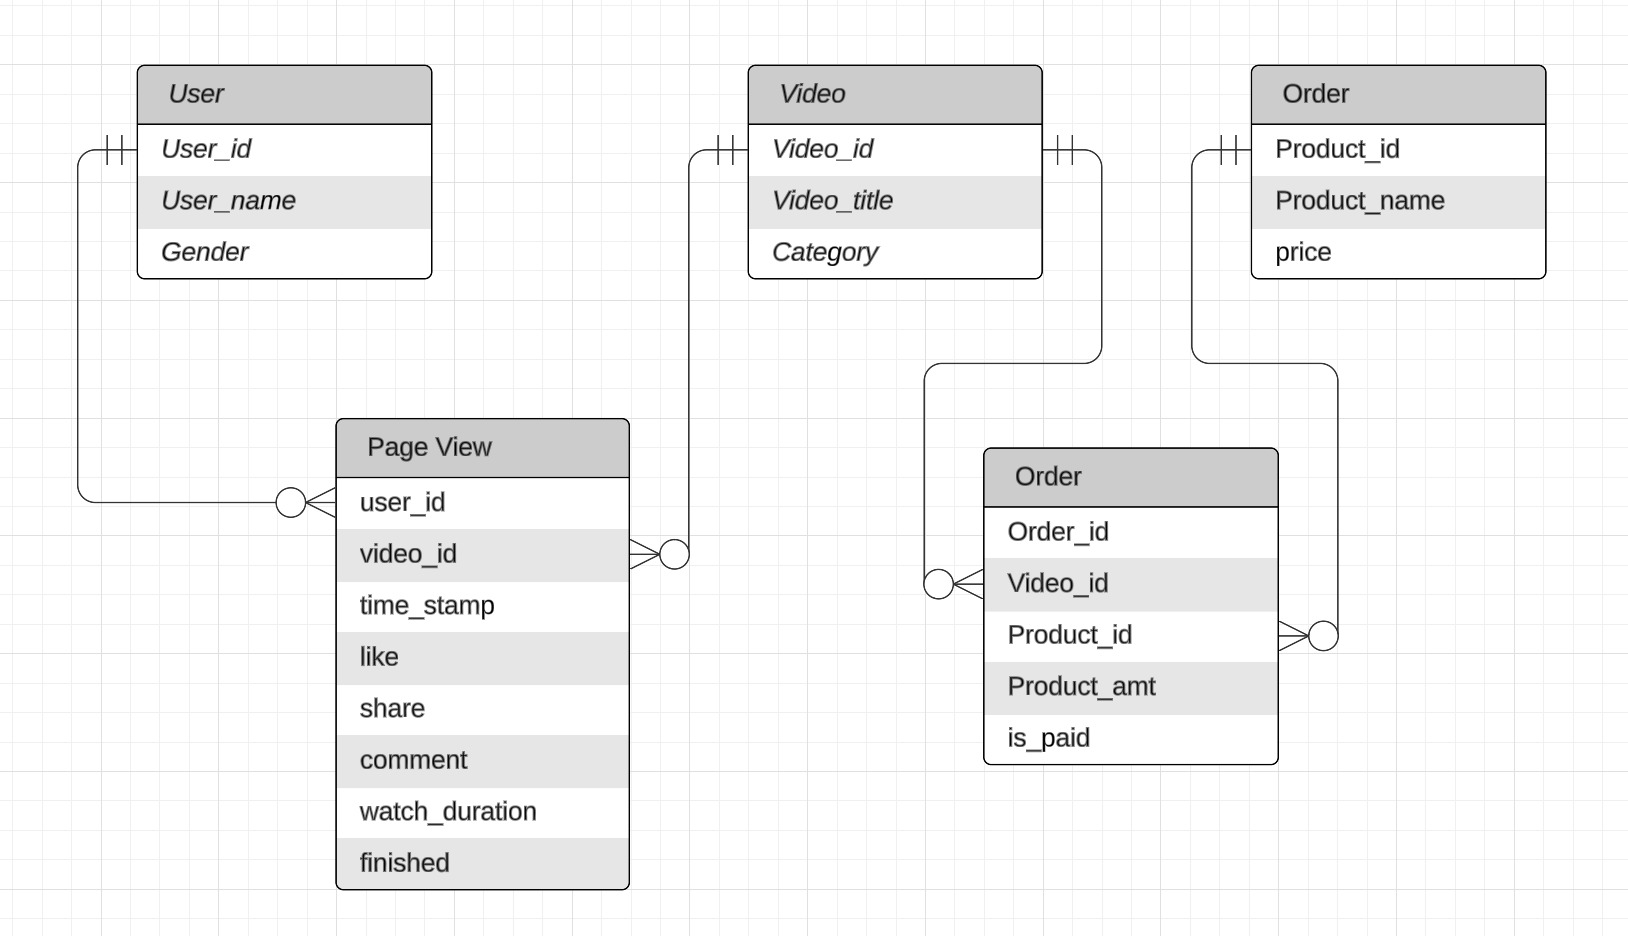
Crow’s Foot Diagram
The crow's foot diagram, also known as the crow's foot notation, is a type of entity-relationship diagram (ERD) used to represent and visualize relational databases. It uses tables to denote entity and its attributes, and lines ended with symbols to represent relationship:
- Crow's Foot: A three-pronged symbol (like a crow's foot) represents a 'many' relationship in an ERD.
- Straight Line: A straight line on the end of a relationship represents a 'one' relationship.
- Circle or Ring: This is used to represent a 'zero' or 'optional' relationship, meaning that the relationship does not necessarily exist for every instance of the entities.
4. Dimension Modeling
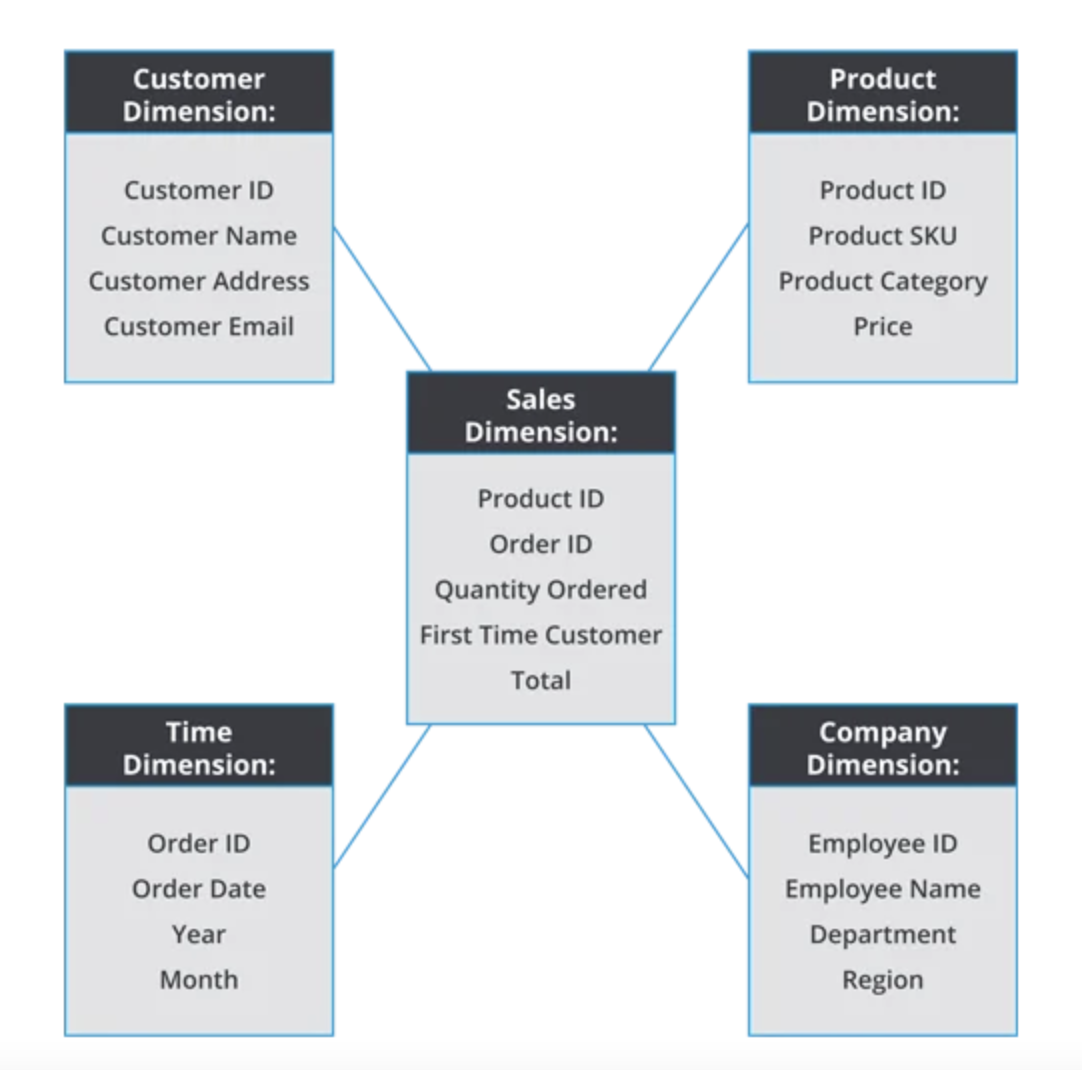
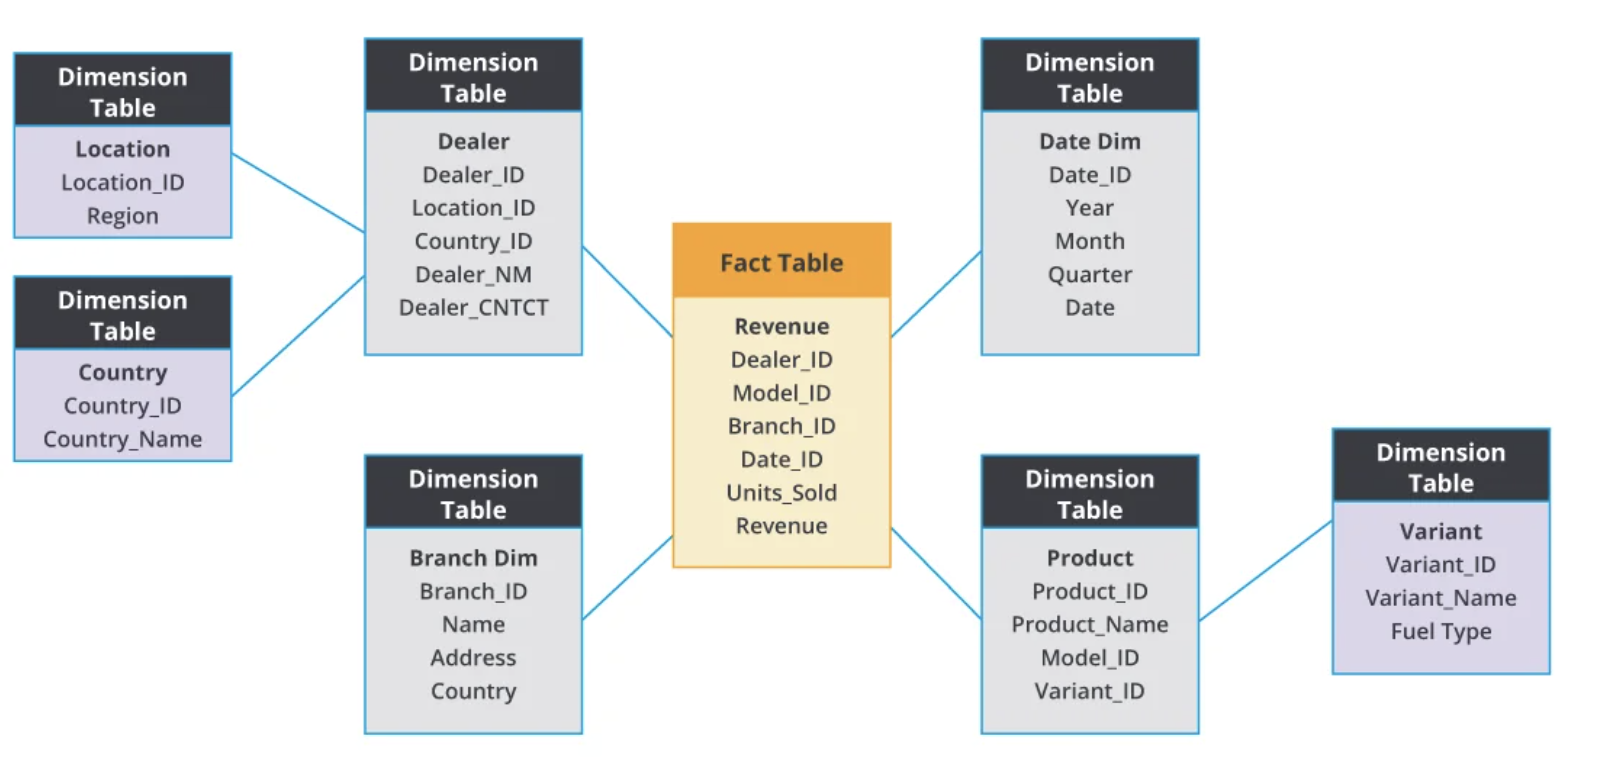
The dimensional model consists of a central fact table surrounded by dimension tables, forming a "star" shape, hence it is often referred to as a star schema. If dimension tables are normalized, it results in a "snowflake" schema.
Fact tables
Fact tables are the central tables in the schema of a dimensional model. They are used in conjunction with dimension tables and they contain facts and keys to dimension tables.
The facts are the measurements or metrics that a business process of interest creates. The fact must be strictly on the grain of data defined by the dimension model.
Dimension tables
Dimension tables are used to describe dimensions; they contain dimension keys, values and attributes. A dimension is a perspective for observing the facts, usually having bigger grain than the grain of fact. Theoretically, the product of the dimension keys should yield the grain of data. The dimension keys are Primary keys that uniquely identify information on the corresponding dimension. The dimensional attributes are measurements contains information about the dimension, they grain are the same as their dimensions. For instance, for the fact of user behavior, there are three dimension: user, video, time. The grain thus is user * video * time. The attributes belong to the user dimension, like "user name"and "gender", are on a greater grain than the facts measure like "share" and "comment"
A dimension Model is bottom-up structure. It first defines the grain, or dimensions of the data according to the extent of details needed to understand the business. Then it select metrics of interest on that grain. Finally it adds information on dimension through attributes. Such procedure decides that a dimension model can more focusing on specific business rather than the overall picture. Besides, it is easier to develop. Thus a dimension model is more suitable for a OLAP database comparing to an ER model. For a business perspective, we can deem the dimension modeling as a kind of decoupling ER modeling
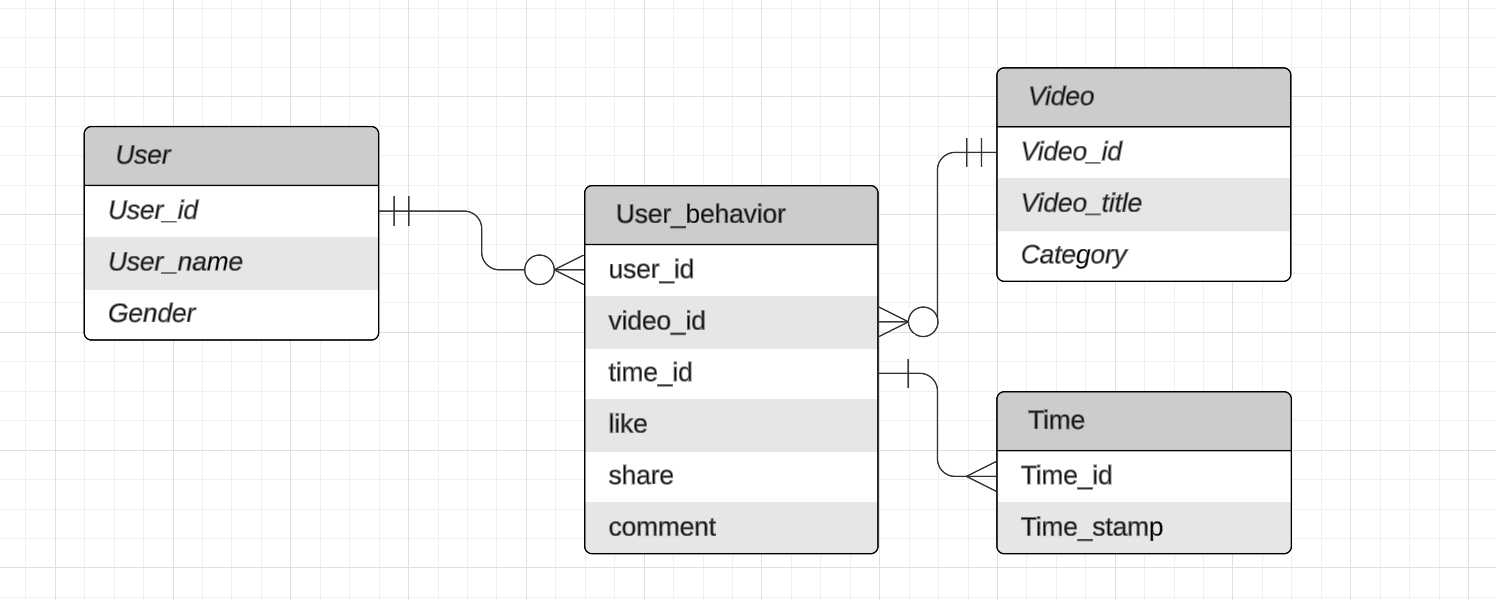
For example, if our task is analyzing user behavior, then in a dimension model, there is no need to maintain the unrelated metrics “watch_duration” and “finished”as well as unrelated entities “order” and “product”.
Roll-up, drill-down and dimension reduction
The roll-up is a operation for a dimension model that refers to aggregating the facts on a dimension attribute. This is usually for description statistics. The drill-down refer to the reverse operation of roll-up, which means decomposing the aggregated metrics by the value of certain dimension attribute. Roll-up and drill down would change the grain of the data.
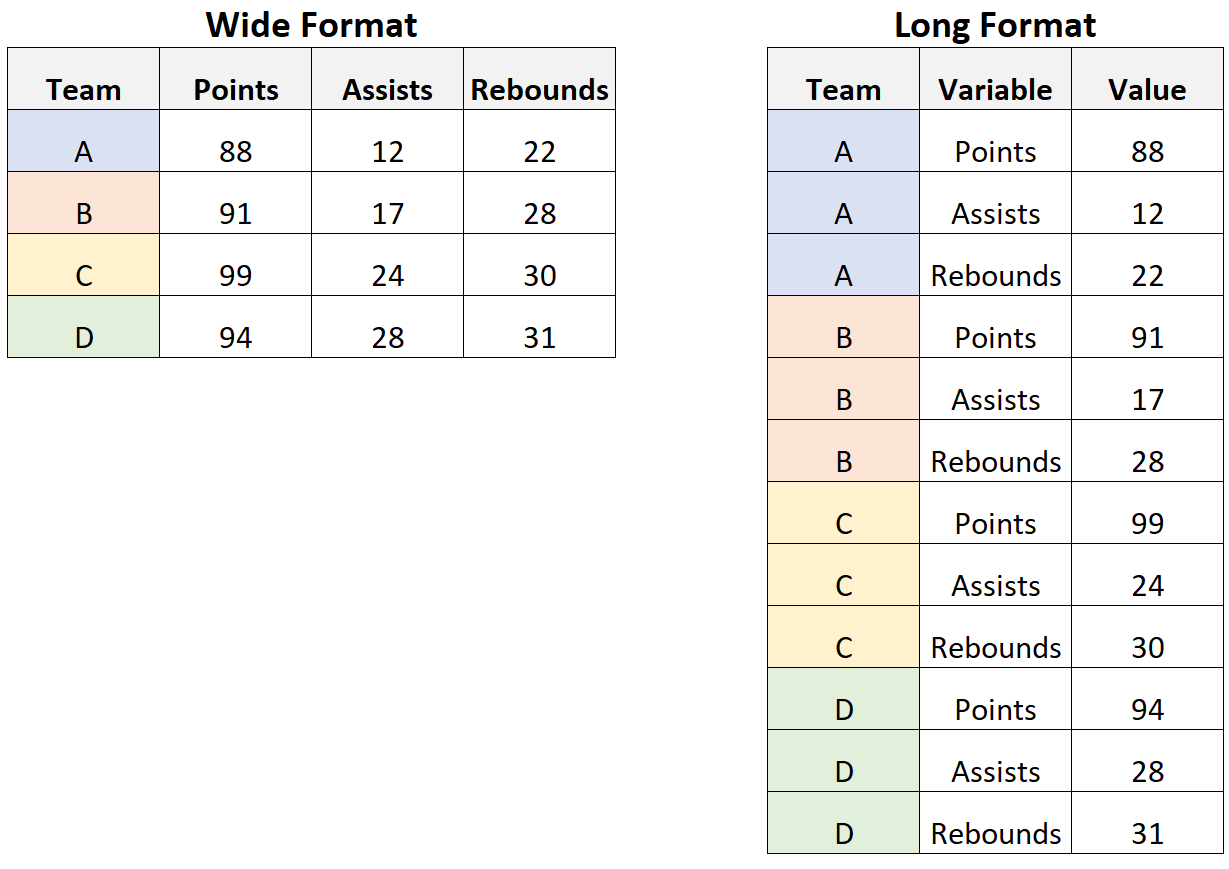
When a dimension has only one attribute, and these attribute has finite value, we can eliminate this dimension, if that make it more delivering, by convert the long table to the wide table. Such a process is called a dimension reduction.
4.2 Schema of Dimension Model
The Schema of dimension modeling includes:
Star Schema
Star Schema is known to create denormalized dimension tables – a database structuring strategy that organizes tables to introduce redundancy for improved performance. Denormalization intends to introduce redundancy in additional dimensions so long as it improves query performance.
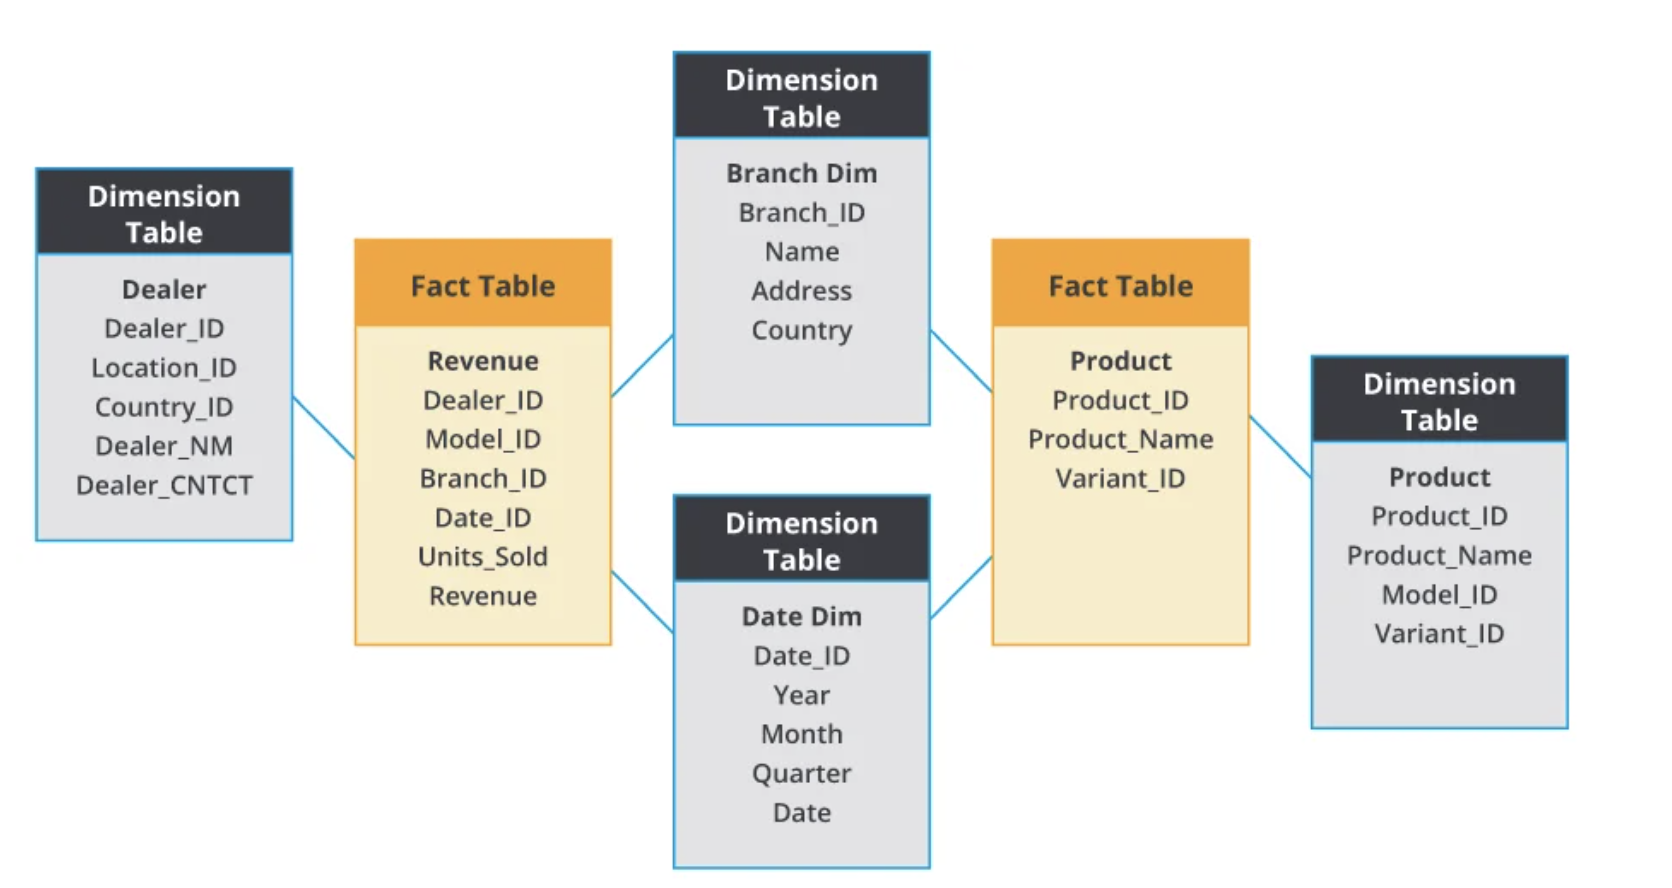
Snowflake Schema
The Snowflake Schema is a data warehouse schema that encompasses a logical arrangement of dimension tables. This data warehouse schema builds on the star schema by adding additional sub-dimension tables that relate to first-order dimension tables joined to the fact table.
Snowflake schema creates normalized dimension tables – a database structuring strategy that organizes tables to reduce redundancy. The purpose of normalization is to eliminate any redundant data to reduce overhead.
Galaxy Schema
In a real implementation of dimension model, such as a data warehouse, the database are usually not for a single business only. A galaxy schema contains multiple fact table for different business, while these facts table can share same dimension tables.
5. Other Data Modeling Methods
Other data modeling method includes Data Vault, which is a derivation of ER model that is more focusing on data integration, and Anchor model, which apply K-V structure and raise the standard to 6 NF. These model are seldomly used by a data scientist in enterprise.