Evaluation for Clustering Model
Evaluation for Clustering Model
1. Evaluation for Clustering Tendency
Before conducting clustering, we usually would evaluate whether there exists natural clustering tendency in the dataset. The most common measure is the Hopkins Statistics.
Let S denote a sample sapce \(S = (s_ 1,s_2,...s_n)\), X denote a feature space \(X = (x_1,x_2,...x_n)\).
Randomly pick a subsample p with k points from the sample space S \(p = (p_1,p_2,...p_k)\). For each \(p_i\), let \(a_i\) denote the distance between $p_i $ and its nearest neighbor in the original sample S: \[ a_i = \min_{s_j \in S}\{ dist(p_i,s_j)\} \] Then we create k artificial points, where each point's \(m^{th}\) feature \(x_m\) is generated uniformly from a distribution \(U(min[S_{x_m}],max[S_{x_m}])\). We call this collection q. For each \(q_i\), let \(b_i\) denote the distance between $q_i $ and its nearest neighbor in the original sample S(the distance must be greater than 0): \[ b_i = \min_{s_j \in S,s_j \ne q_i}\{ dist(q_i,s_j)\} \] Define the Hopkins statistics as: \[ HS = \frac{\sum_i^k b_i}{\sum_i^ka_i + \sum_i^k b_i} \] If the data points are randomly distributed in the sample space, the HS should be approximately 0.5. The closer HS is to 1, the stronger clustering tendency there exists. Usually, we consider conduct a clustering if \(HS > 0.75\)
2. Evaluation for Clustering Goodness
The evaluation for Clustering Goodness can be categorized as internal evaluation and external evaluation. In external evaluation, we suppose we do have groud truth(true label) in the training process, but we still will not have that label in real application when the model is online. In such scenarios, we can simply use loss in classification and metrics in classification evaluation, such as entropy, impurity, accuracy and F-1 score.
However, the more common scenario is that we do not have a label to evaluate the quality of the clustering results even in training. In this case, we would need internal evaluation. Usually, we would consider a clustering results to be better if the points are compact inside a cluster while the clusters are sparse in the whole space. Thus, we often construct measure based on the internal distance of a cluster \(C_i\) and the external distance between two cluster \(C_i,C_j\). Notice evaluating the model on a single metrics can be vert biased, as different metrics prefer different number of clusters. In most application, we would integrate multiple metrics to evaluate a clustering model.]
Distortion
The overall distortion is defined as: \[ D = \sum_k^K\sum_{x_i \in C_k} ||x_i - \mu_{C_k}||^2_2 \] Where \(\mu_{C_i}\) is the centroid of \(C_i\),
The smaller distortion is, the better the clustering results are. We can replace the distance calculating method to \(||x-\mu||^p_p\)
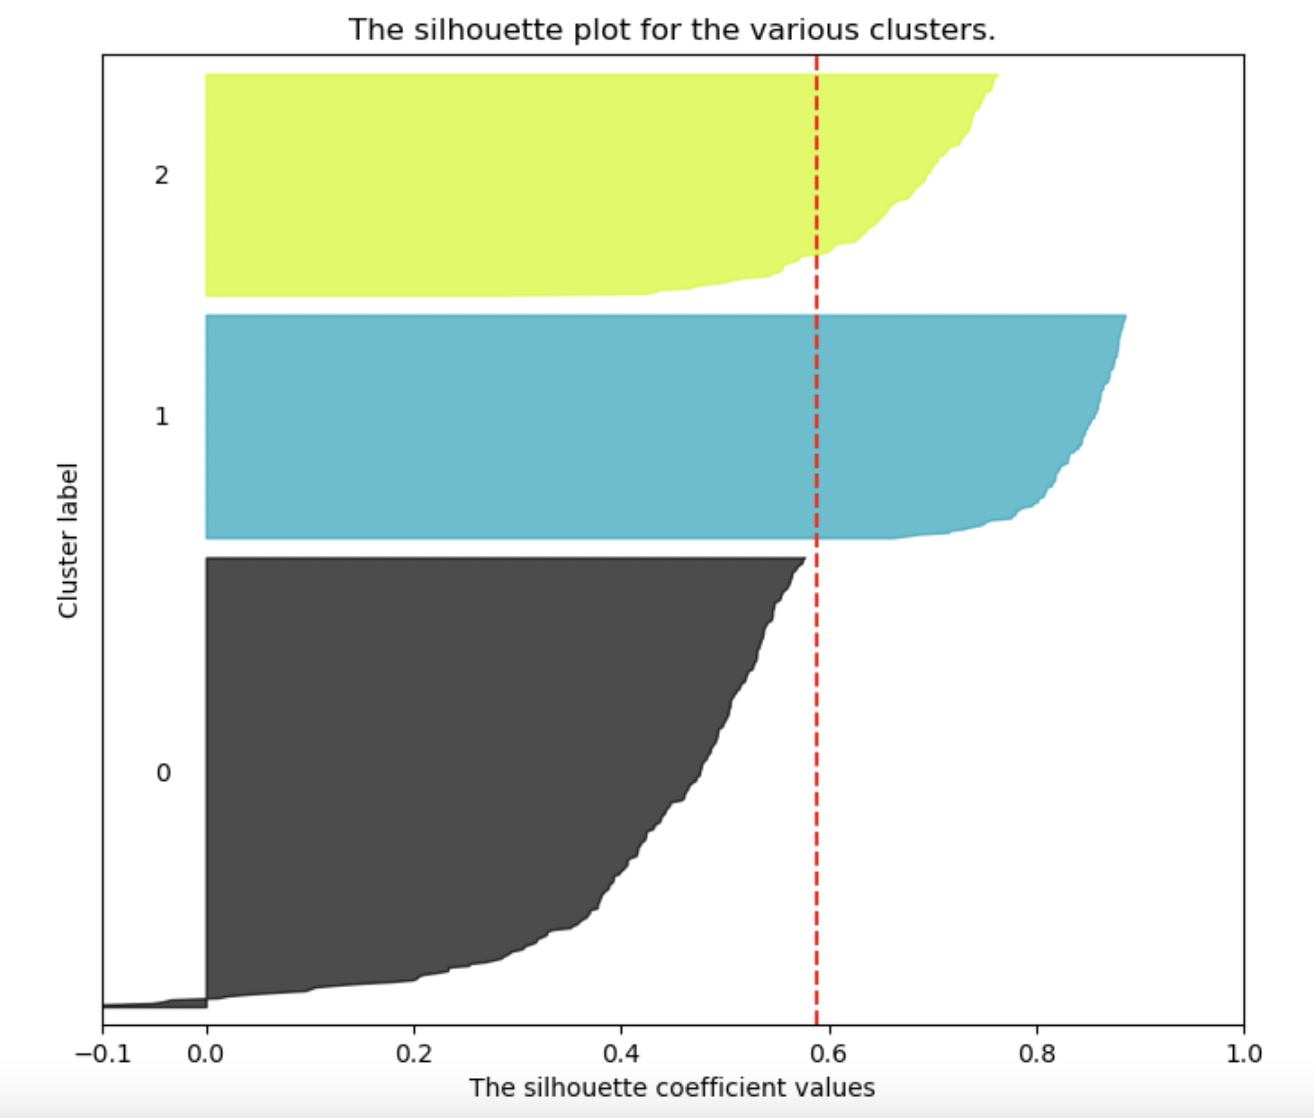
Cohesion, Separation and Silhouette Coefficient
These three metrics are all on a sample point level.
The Cohension is the averge distance between a sample and all other samples in the same cluster: \[ a(i) = \frac{\sum_{j \ne i, j \in C_k} dist(x_i,x_j)}{N_k-1} \] where \(N_k\) is number of samples in Cluster k.
The Separation is the averge distance between a sample and all other samples in the nearest neighbor cluster: \[ b(i) = \frac{\sum_{j \in C_{nn}} dist(x_i,x_j)}{N_{nn}-1} \]
Good clustering performance should yield small a(i) and great b(i). Thus, we define the silhouette coefficient of a data point as: \[ s(i) \ \frac{b(i) - a(i)}{max\{a(i),b(i)\} } \] we can find that when s(i) <0, b(i) < a(i), which means the clustering algorithm is invalid on this sample. When b(i) > a(i), s(i) is in [0,1]. The greater s(i) is, the better clustering performance is.
We can then calculate the overall s(i) by average:
Calinski-Harabasz Index
The Calinski-Harabasz Index is the ratio of the within-cluster- distance and between-cluster-distance. The within-distance is defined samely as distortion: \[ W = \sum_k^K\sum_{x_i \in C_k} ||x_i - \mu_{C_k}||^2_2 \] while the between-distance is defined as the weighted sum of the distance between centroid of cluster k and centroid of all samples: \[ B = \sum_k n_k \ ||c_ k-c||^2_2 \] Define the CHI as: \[ CHI = \frac{B}{K-1}/\frac{W}{n-K} \] where n is the number of all samples. The greater s is, the better clustering performance is. The theoratical range of CHI is \((0,+\infty)\). Note that CHI often prefer smaller number of cluster, while small K gives high CHI, it could also give high distortion. Again, we should evaluate the performance based on multiple metrics as a integer.
3. Evaluation for Clustering Stability
A clustering should be stable that it can remain same on clustering results(low variance) when the sample points vary. Suppose $D $ is the original sample set, \(D'\) is another sample set drawn from the same population, \(C\) is a clustering plan. If we can find a distant function \(d\) to measure the similarity between the clustering results, then we want: \[ d[C(D),C(D')] \approx 0 \] Thus, we can apply such steps to test the stability of a clustering plan:
- Generate \(m\) perturbed versions of the original dataset \(D\), denote as \(V = \{v_1,v_ 2,...v_ m\}\)
- For each version, conduct clustering plan \(C\) and obtain and clustering results \(C_ i\)
- For each pair of \((i, j)\) in m, compute the distance \(d(C_i,C_j)\)
- The overall instability metric would be \(I(C) = \frac{1}{m^2}\sum_{i, j}d(C_i,C_j)\)
These procedures brings the following question:
Generating perturbed versions
Solutions includes:
Draw a random subsample from \(D\) with or without replacement
Add random noise to the original \(D\)
Create artificial samples through oversampling methods
Distance Measure
The clustering results of \(C_i\) and \(C_j\) is formed as:
| Data points | \(C_i\) label | $C_j $ Label |
|---|---|---|
| \(x_1\) | 1 | 2 |
| \(x_2\) | 3 | 3 |
| ... | ... | ... |
| \(x_n\) | k | k |
These can be seen as two collections \(\{(x,C_i)\}, \{(x,C_j\}\) or two sequnce \(C_i, C_j\) by taking \(x\) as index. Thus we can use the following metrics to measure the distance:
- Minimal Matching Distance
- Jaccard Distance
- Hamming Distance
Details of these metrics can be found in this article