Basic Procedure of A/B Testing
Basic Procedure of A/B Testing
About A/B Testing
A/B testing is a user research technology. It is a random controlled experiment usually involves two variants: treatment group and control group. From a hypothesis perspective, an A/B test is a two-sample independent test for difference.
Step1: Problem Statement
An A/B test should always have an business drive. This can usually be concluded into several product sense framework like AAARR and STAR
Step 2: Pre-experiment Analysis
The purpose of pre-experiment analysis is to figure out an specific solution for the problem stated, in other words, the treatment. Common techniques include EDA, user segmentation and machine learning.
In a A/B testing case interview, the treatment are usually provided by the interviewer. The task for the interviewee would be to infer the business drive beneath the treatment and find according metrics to measure success.
Step 3: Metrics Selection
This task is very similar to another type of case "measure success". However, for an A/B test, the following facts about a metric should be considered:
- Sensitivity: The metrics should be sentitive and timely. Avoid metrics that needs a long time to demonstrate changes.
- Attributable: Avoid those metrics associated with high-level business goal. These metrics are impacted by many facotrs. They can be insensitive to a particular experiment or be hard for us to attribute the significance on a single treatment.
- Aggregated: The metric should be defined on an aggregation of a measure that is meaningful to every unit. Only by doing that can be regard the meaure on a single unit as a random variable and apply CLT.
- Measurable : The metrics should be clearly defined and measurable. They should not exceed the time or space frame of the experiment
Step 4: Experiment Design
Define Experiment Groups
Randomized Unit
The randomized unit is the smallest grain that the metrics defined on. In most applications, the randomized unit is a user. Options for finer grains exists:
- Page Level: the smallest unit is a page view
- Session Level: the smallest unit is a group of web page viewed in a single visit
- User Level: the smallest unit is a user. The minimal grain of the metrics should be associated with a user ID, device ID or coockies, such as a UV. Shared account/device can lead to undercounting, while multiple account/device by one user can lead to overcounting. Cookies can be erased, leading to overcounting of users
Finer grain can increase the number of available units and lower the varianve. Nevertheless, do not use finer grain if the objective of the feature is meant for the user level, such as user experience or user engagement. The analysis unit and the randomized unit is not on the same level if we do so. This can lead to Violation of SUTVA and lead to misinterpretation.
For example we want to know the probability a user clicked a new button. If we use CTR, based on a PV, then let n denote the number of users, \(K_i\) denote the number of PV by the user i. Let \(N =\sum_iK_i\) denote the total number of PV, and \(X_{i,j}\) be a bernoulli variable denoting whether the user i click the button in his \(j^{th}\) PV(suppose a user can only click the button once).
The CTR is defined as: \[ CTR = \frac{\sum_i\sum_jX_{i,j}}{N} \] This definition is logically right, however, if the real randomization strategy is applied on user, not PV, then there is a violation of SUTVA. The randomization strategy ensures the user are exposed with the treatment randomly, not the PV. The behavior from the same user in different PV can be not independent. In other word, when i is fixed, \(X_{i, 1},X_{i, 2},...X_{i, j}\) can be correlated. This lead to mismatch of randomization unit and analyzing unit. In this case, we cannot calculate the variance of CTR using the i.i.d assumption. The variance can then be incorrectly estimated and lead to a misinterpretation in the experiment.
Insteadly, we can aggregate the metric in to the average Click Through Probability: \[ average \ CTP = \sum_i^n\frac{ \frac{\sum_j^{K_i} X_{i,j}}{K_i} }{n} \] It first aggregate the metrics to the probability that a single user click through \(\frac{\sum_j^{K_i} X_{i,j}}{K_i}\) and use it as the analysis unit, which is consistent with the randomization strategy. According to the CLT, this variable should follow a normal distribution, and user are randomized, thus the CTP for each user should be i.i.d. We can then estimate the standard error under the i.i.d assumption.
Target Group
The target population the feature meant for. This is usually a subset of all users conditioned on the following dimensions:
- Region: Country, Province
- New/Old User
- Language: English, Chinese
- Industry: Cloth/Furniture/...
- Conversion Stage: We should focus on the users that the feature are meant to perform on. If a user have not yet gome through the user funnel and do not hold a chance to experience the feature, they should not be selected for the experiment
From Historical Data
Some parameters need to gathered from historical data:
Baseline of Metrics: The historical level of metrics on control group and treatment group. The value should be the same(or very close). If there's a difference, conduct a pre-difference analysis(A/A test, metric decomposition)
Variance: The estimation of variance on the target population. Since we have not calculate the sample size and split the samples into control and treatment group, it is difficult to estimate the vairiances for two different population from samples. A solution is to assume the variance of both population are the same and estimate the variance through the variance of all samples. If there are any histroical split, like a previous A/B test or A/A test, we can consider estimate both variance.
From Business Goal
Practical Significance Boundary
The minimal extent of difference of interest from a business aspect. Usually the researcher first define a minimal relative difference(MRD, usually 1%~5%), and calculate PSB through baseline*MRD. The PSB is taken as an expected MDE to calculate the minimum sample size
For Hypothesis Testing
The details of the hypothesis testing can be found in this article.
\(\alpha \ and \ \beta\)
Decide the significance level and statistical power. Usually, we set \(\alpha = 0.05\) and \(\beta = 0.8\) as an initial value
Minimum Sample Size
The sample size is decided throguh experience formula. For A/B testing:
A mean test: \[ n = \frac{(\sigma_1^2+\sigma_2^2)(z_{\alpha/2}+z_{\beta})^2}{\delta^2} \] A ratio test: \[ n = \frac{Z_{\alpha/2}\sqrt{\frac{p_1+p_2}{2}(1-\frac{p_1+p_2}{2})}+Z_\beta\sqrt{p_1(1-p_1)+p_2(1-p_2)}}{p_1-p_2} \] In real applications, for a mean test, if we feel like the respective variances are hard to obtian or we can't decide whether we would apply a Z-test, we can simply apply the rule of thumb: \[ n = 16\frac{s^2}{\delta^2 } \qquad for \quad two-tail \]
\[ n = 8\frac{s^2}{\delta^2 } \qquad for \quad one-tail \]
Test Duration
The longer the experiment runs, the more sample we can obtained. Usually the sample size can be calculated from: \[ Days \ of \ test = \frac{ Minimum \ sample \ size}{Daily \ available \ unit \ traffics} \]
However, the following aspects need to be considered when deciding the test duration
- Day of week effect: Weekends might lead to different user behavior had raise up the metrics. It's important to ensure that your experiment capture the weekly cycle
- Seasonality: Holidays or annual events that can have a impact on the metrics. Try to avoid or correct the effect of these events if the test are for plain time
- Primacy and novelty effects: Some existing users might tend to be reluctant to change(Primacy Effect), while other existing users might tend to welcome change. Both effects will diminish as time growing. To ensure the stability of the test, the duration should cover the period when these two effects are working
Experiment Type
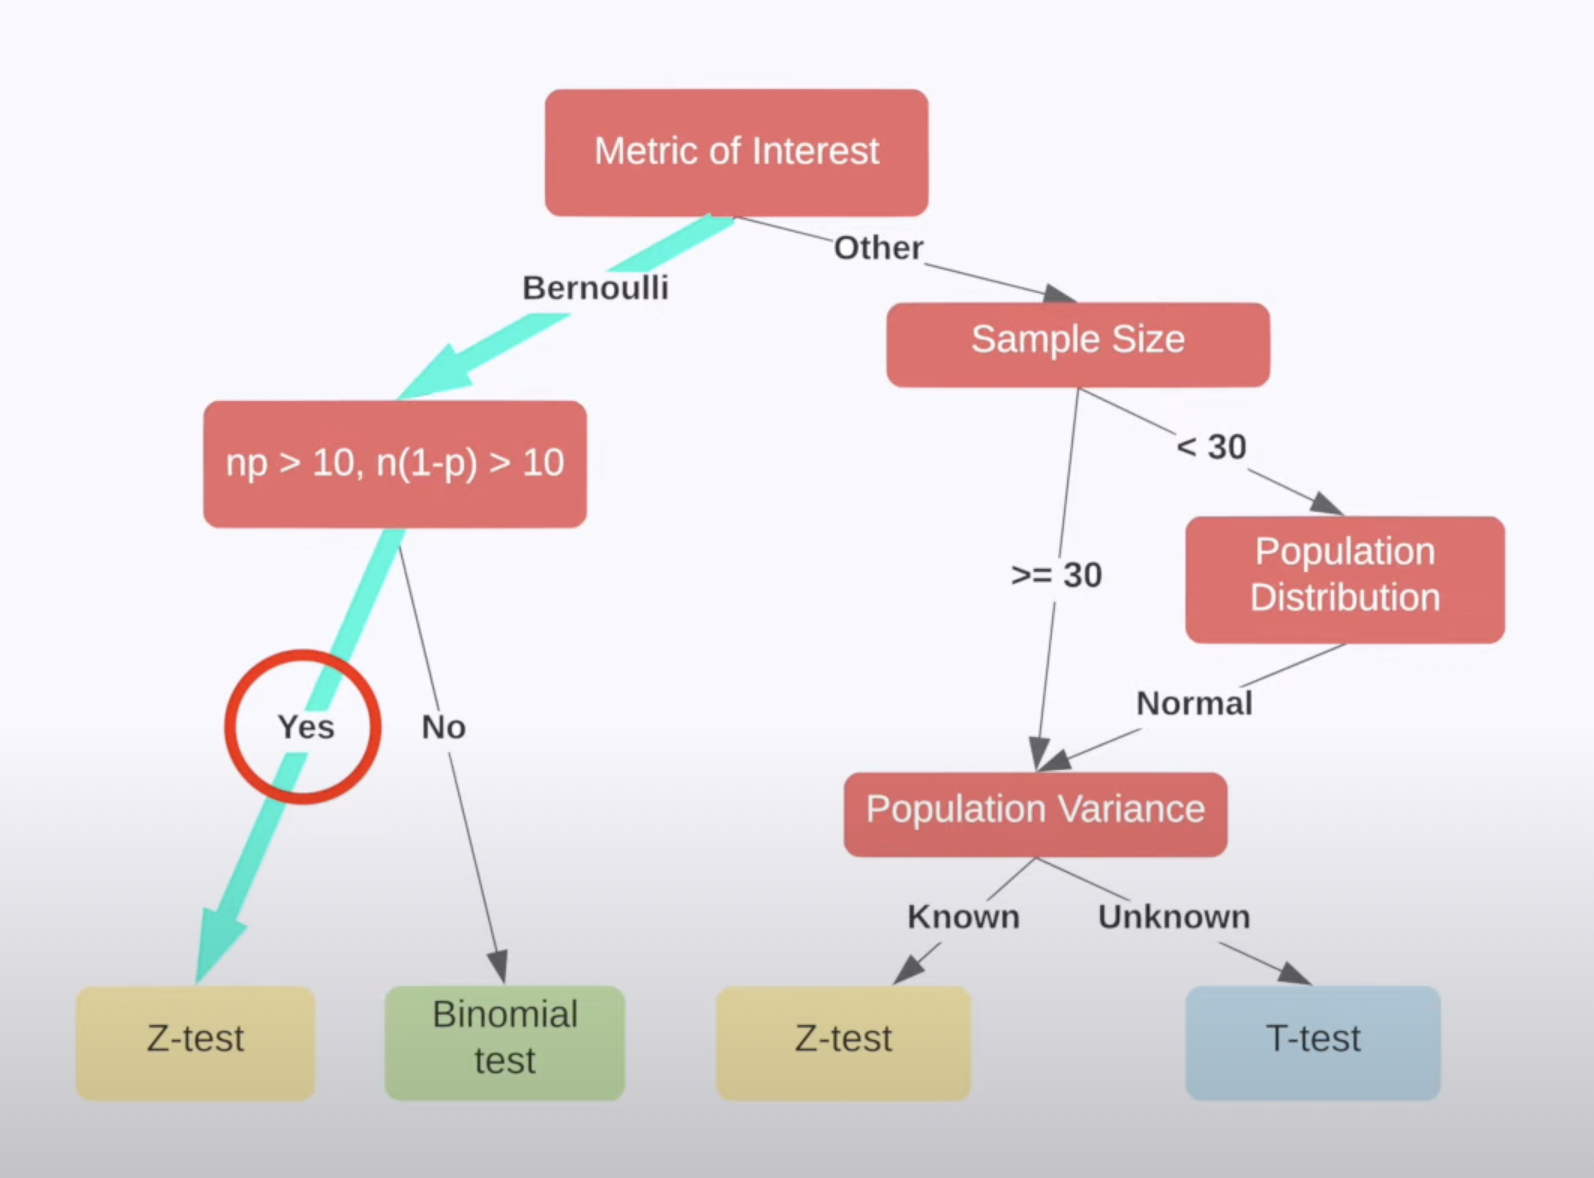
An A/B testing is an test to examine differential of metrics between control group and treatment group. Thus, in most case we selecte a T/Z test.
For an A/B testing, the experiment should be a two-sample independent test. If the \(\sigma\) of the population is unknown, we should consider a T test. If the \(\sigma\) is known, for example it is a ratio test, we should apply a Z-test if available samples are more than 30, and a T test if the number is less than 30.
Construct Test Statistics
The construction of test statistics is decided by the type of experiment and the assumption that whether the variance of the two group are the same. We can consider examining the equality of variance through a F-test based on the experiment samples or any historical data.
Step 5: Experiment Deployment
Traffic Distribution
As an A/B test is a random controlled experiment, the randomness of assignment of units must be ensured. The simplest method to ensure concurrent experiments for different tratments do not influence eanch other is the Simple Layer Method, which is to divide all traffic with each experiment variant receiving a specified fraction of the total traffic:
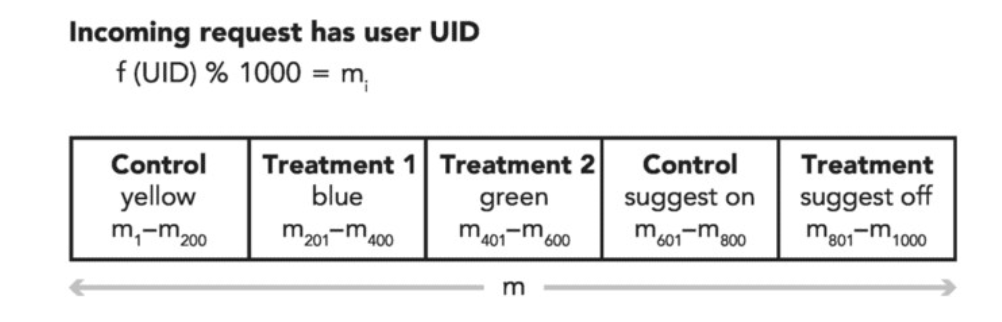
Nevertheless, this method requires that the total needed sample size for all concurrent experiments does not exceed the total available traffics. This put limits on the number of concurrent experiments
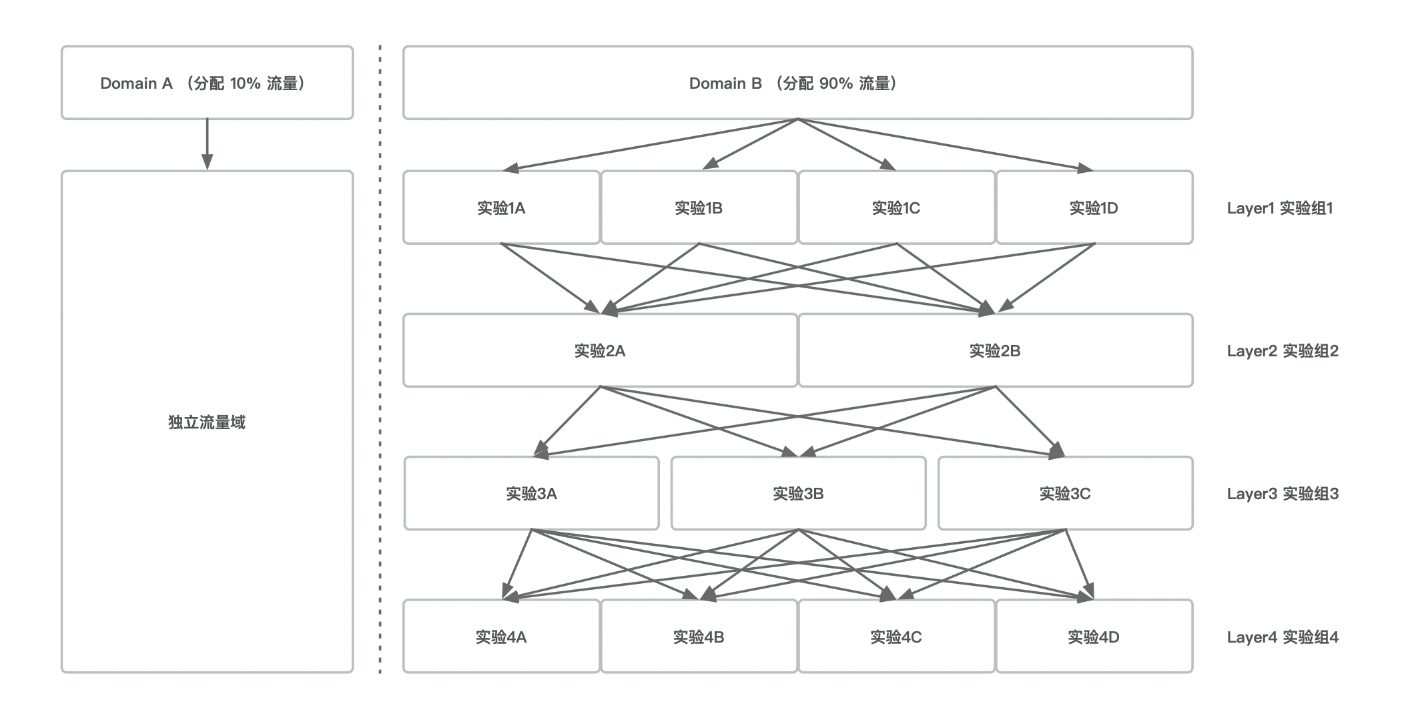
To handle with numerous concurrent experiments cases, we can apply multiple-layer orthogonal traffic method, where each layer is a copy of all or a fraction of total traffic. The re-assignment of a unit accross two layers are random. The groups of experiments are allocated on this layers and each group are expected to receive units randomly from all groups of the above layer.
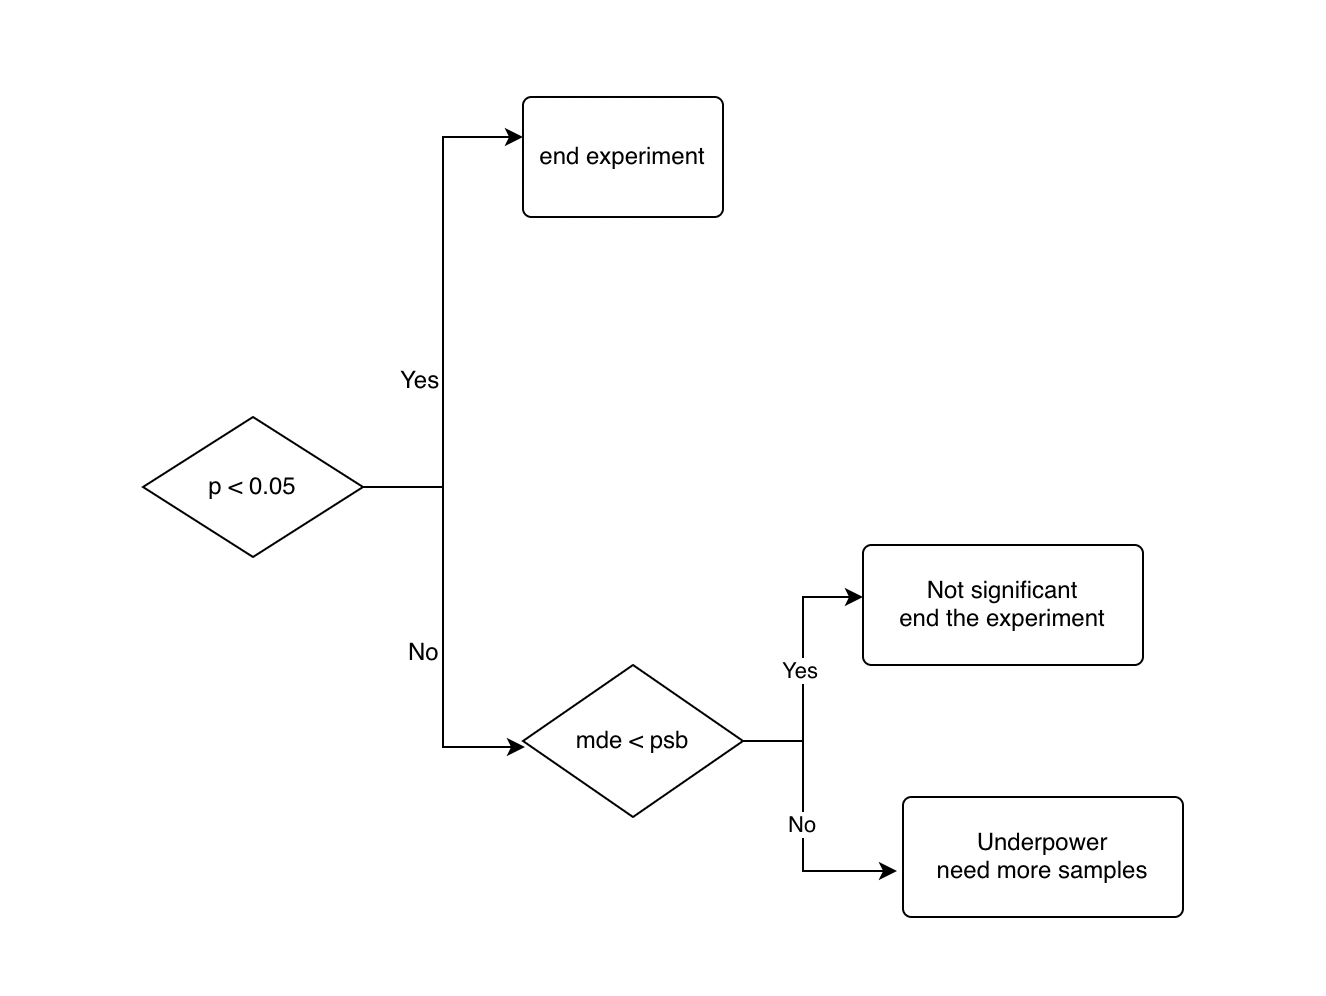
When to Stop
The typical rule for experiment stopping is No Data Peeking: wait until the experiment reach its duration and then analyze the results. However, in real applications, we might need to monitor the experiment and decide whether to end an experiment after the duration is reached. When the duration is reached:
Step 6: Experiment Results Analysis
The analysis process of the experiment results can be found in this article
Step 7: Lauch Decision
After we are assured that the effect of the treatment is significant and truthworthy, there's still some aspects we need to consider before we deciding to lauch the new feature
Metrics Trade-off
Lauch Costs
Rampling Process